How can we identify sunny or cloudy days from the Solar Water Heater IOT data logger ?
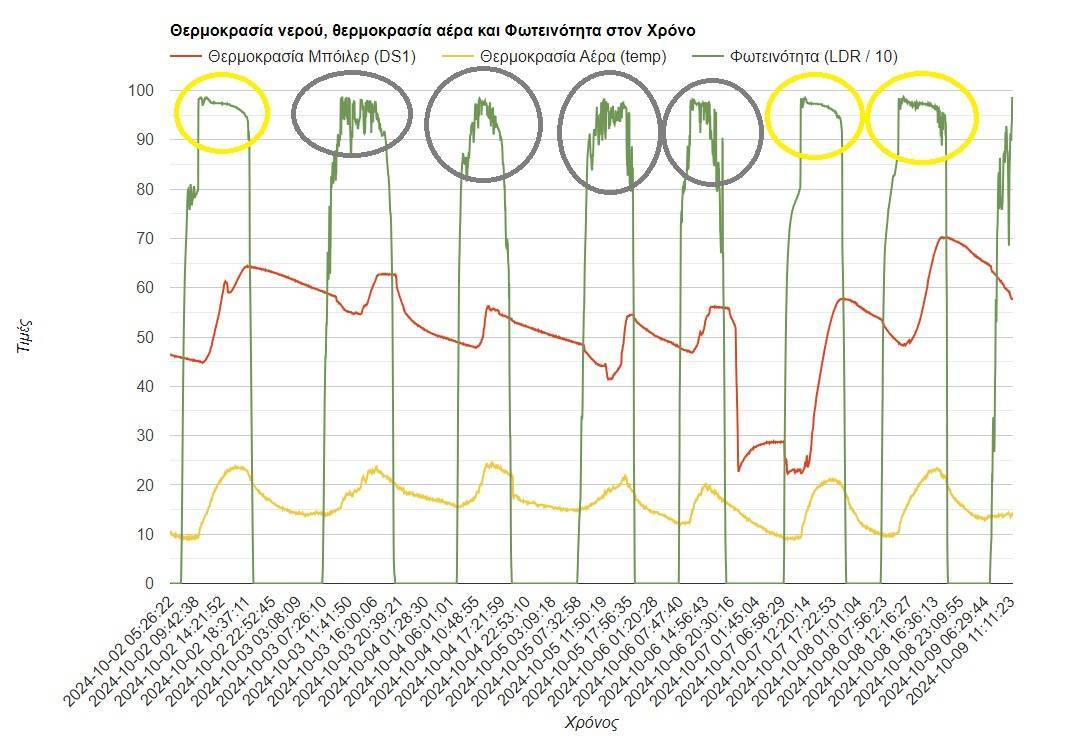
The digital logger of the SWH ONILNE project, in addition to measuring the boiler temperature ( hot water usage ) and the ambient temperature, also records light intensity data. For this purpose, an LDR sensor is used. On the charts, we can see the variation in light intensity, so we can know in real-time the current light intensity while viewing the website, and also review the historical data for any recorded day to understand its profile (strong sunshine, partial cloudiness, heavy cloud cover, etc.). The chart below clearly shows how we can read light intensity. Of course, we observe that on days with strong and stable brightness throughout the day, the solar output is significantly higher. On days with strong fluctuations in brightness, which practically means periods of heavy cloudiness, the performance of the solar water heater is reduced. For the Solar LIVE data logging project, a live web camera has also been installed, which can verify the local weather conditions through live images.
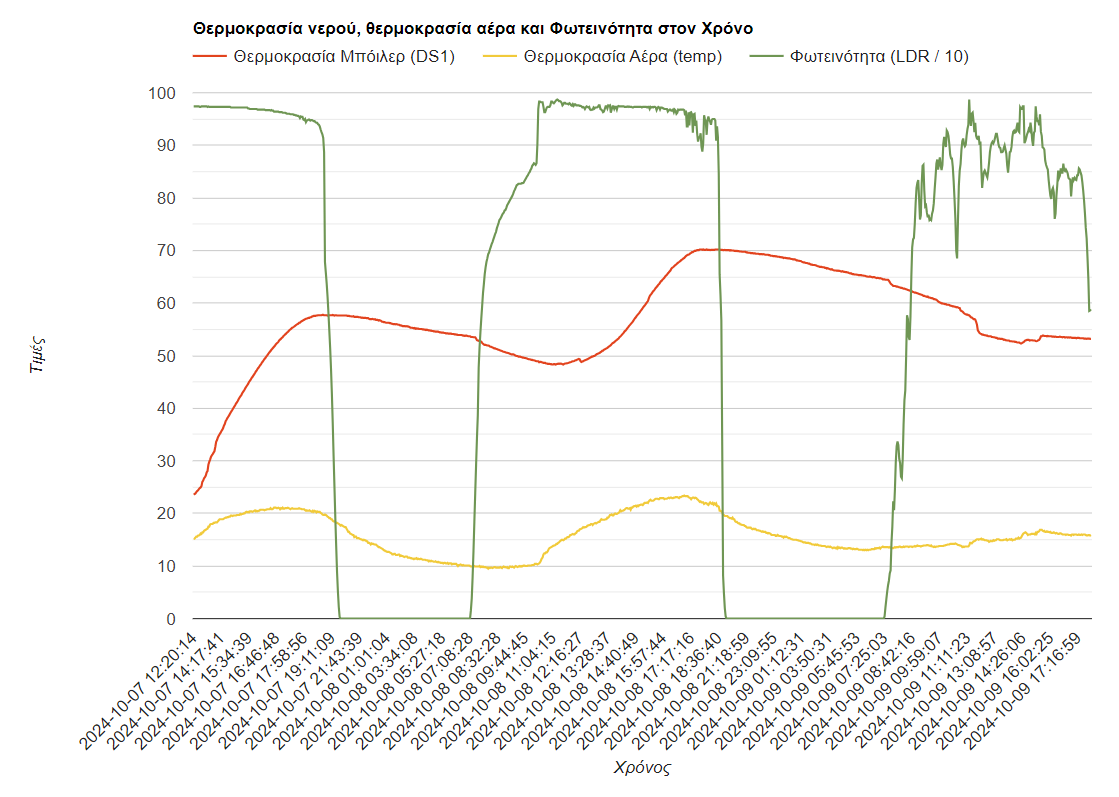
In the 48-hour chart it is clearly shown what a cloudy day looks like:
MSc in Environmental Education
Specialization in Educational Robotics and STEM
Specialization in E-learning and Educational Content Production
Certified Adult Educator
- Improvements in the Placement of the Data Logger - 29 January 2025
- Solar Water Heater Statistics – December 2024 - 10 January 2025
- Washing machines with dual water supply - 24 December 2024