Extended Period of Heavy Cloud Cover and Solar Water Heater Performance
Chart for a Period of Heavy Cloud Cover and Solar Efficiency
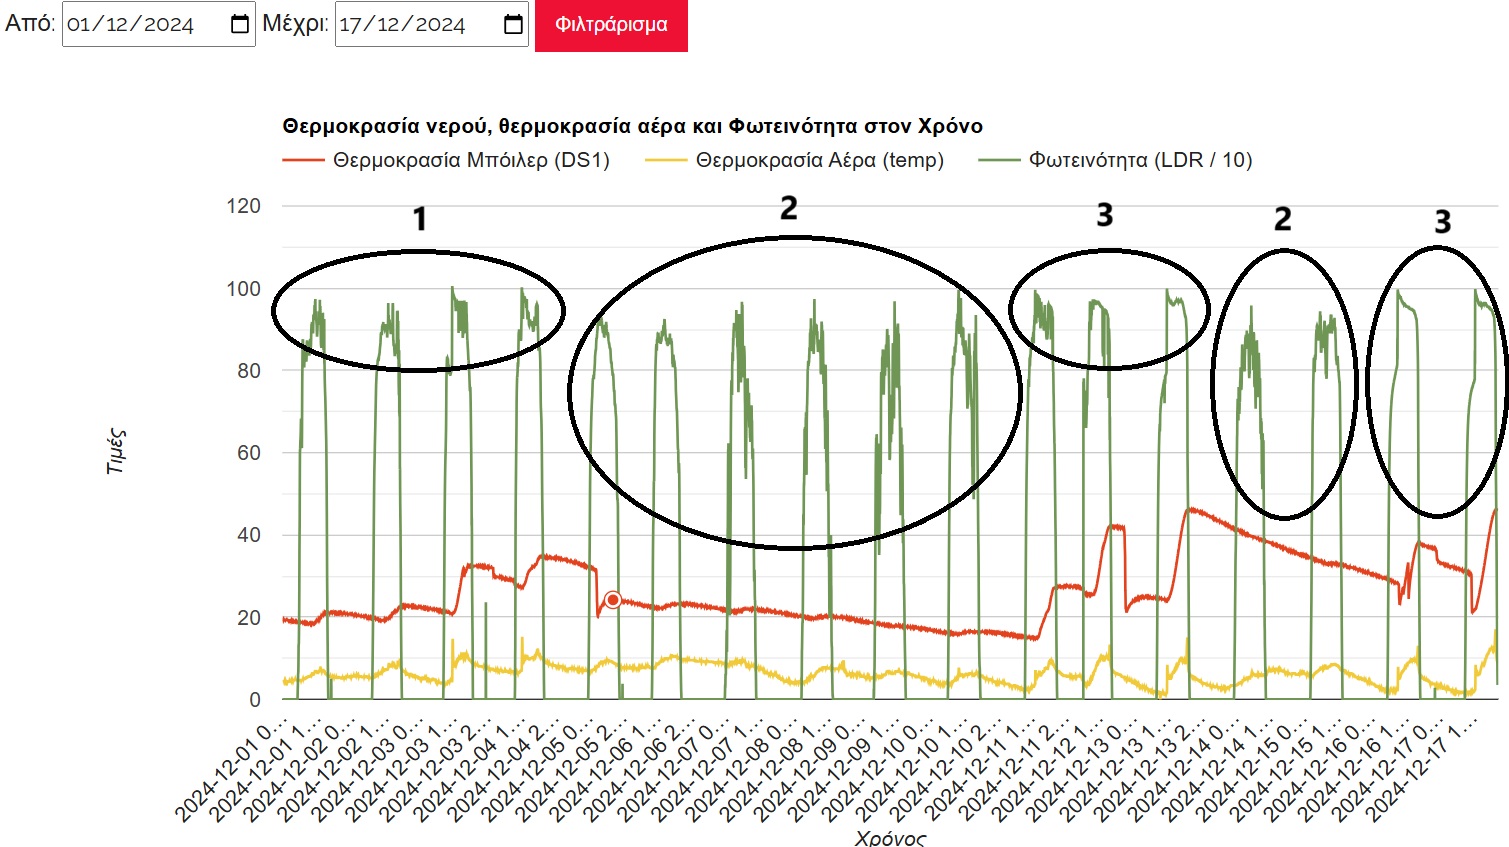
Chart Commentary
The period from December 1st to 17th, 2024 includes a representative section for case study, essentially one of the worst periods ever recorded by Solar LIVE in terms of solar water heater performance, that is, hot water production. Specifically, from December 5th to December 11th, 2024, there was a recorded five-day stretch of continuous heavy cloud cover when there was virtually no output from the solar water heater and the water temperature decreased day and night. More typical periods are also presented below for comparison.
- In this section, we see expected performance where there is heavy cloud cover and low output from the solar system. Temperatures are normal for the season.
- This section, which is the reason for this report, highlights the very heavy cloud cover that persisted for five days and is proven by the light intensity sensor readings on the graph. Very high fluctuations, major deviation from maximum values, and very low average daily luminance were recorded. The same happened a few days later, showing how December—with the shortest days and typical winter weather—can result in periods of zero solar output, during which an alternative hot water heating source is necessary.
- For easier comparison, the chart also includes a period of strong sunshine in the heart of winter, showing how solar water heaters can still perform well during the winter. On December 17th, with all-day clear skies, the water reached almost 47°C, starting from around 21°C.
Conclusions
- During winter, periods of such intense cloud cover can occur, during which the solar water heater has zero output. Therefore, we cannot rely exclusively on it, but such periods are rare (except in areas with persistent fog, which are an exception).
- Even on the shortest days of the year, sunshine is sufficient to heat an adequate amount of hot water for use.
Table of Prevalent Values During the Selected Period
| Ημέρα | MIN DS1 Ηλιακός |
MAX DS1 Ηλιακός |
AVG DS1 Ηλιακός |
MIN Temp | MAX Temp | AVG Temp | AVG LDR |
|---|---|---|---|---|---|---|---|
| 2024-12-16 | 22.94 | 38.06 | 32.03 | 1.9 | 13 | 4.7 | 347.13 |
| 2024-12-15 | 30.69 | 35.94 | 33.16 | 4.2 | 8.6 | 6.48 | 328.05 |
| 2024-12-14 | 35.88 | 43.75 | 39.6 | 2.4 | 7.4 | 5.19 | 292.96 |
| 2024-12-13 | 24.13 | 46.13 | 34.92 | 0 | 15 | 4.54 | 350.53 |
| 2024-12-12 | 21.06 | 42.06 | 32.02 | 3.1 | 13.3 | 6.36 | 438.74 |
| 2024-12-11 | 14.75 | 27.56 | 21.07 | 2.2 | 9.6 | 5.17 | 342.64 |
| 2024-12-10 | 15.69 | 16.75 | 16.26 | 3.5 | 7.7 | 4.85 | 313.54 |
| 2024-12-09 | 16.75 | 19.25 | 17.93 | 4 | 7.1 | 5.79 | 280.07 |
| 2024-12-08 | 19.25 | 20.94 | 20.03 | 3.8 | 9.5 | 6 | 284.73 |
| 2024-12-07 | 20.88 | 22.5 | 21.7 | 4.5 | 9.6 | 7.85 | 262.95 |
| 2024-12-06 | 22.13 | 23.31 | 22.76 | 7.5 | 10.7 | 9.18 | 327.35 |
| 2024-12-05 | 20.5 | 33.5 | 26.79 | 6.7 | 9.6 | 7.89 | 338.78 |
| 2024-12-04 | 27.31 | 34.63 | 31.74 | 6.1 | 15.2 | 8.36 | 333.51 |
| 2024-12-03 | 20.81 | 32.56 | 27.15 | 3.6 | 14.7 | 7.16 | 333.43 |
| 2024-12-02 | 19.13 | 22.69 | 21.03 | 4.9 | 9.9 | 6.29 | 320.77 |
| 2024-12-01 | 18.31 | 21.06 | 19.82 | 4.3 | 7.7 | 5.44 | 325.55 |
Computer Science Educator
MSc in Environmental Education
Specialization in Educational Robotics and STEM
Specialization in E-learning and Educational Content Production
Certified Adult Educator
MSc in Environmental Education
Specialization in Educational Robotics and STEM
Specialization in E-learning and Educational Content Production
Certified Adult Educator
Latest posts by Thomas Karaferis (see all)
- Improvements in the Placement of the Data Logger - 29 January 2025
- Solar Water Heater Statistics – December 2024 - 10 January 2025
- Washing machines with dual water supply - 24 December 2024
Visited 263 times, 1 visit(s) today