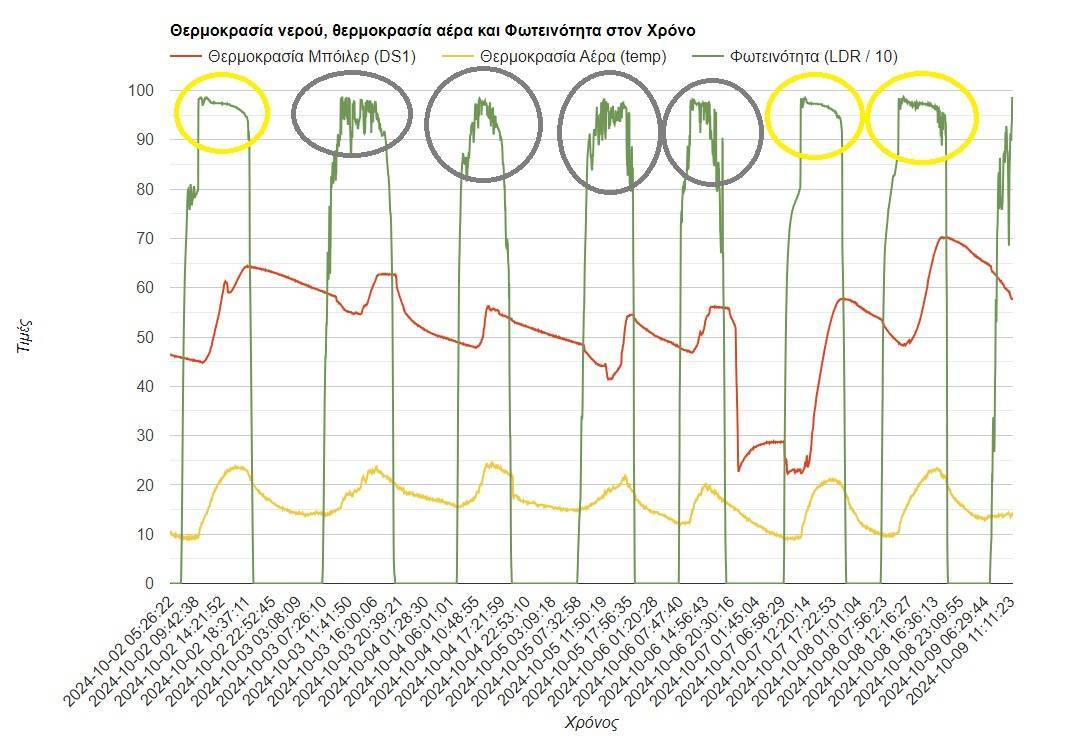
Wie können wir anhand des Solar-Warmwasserbereiter-IOT-Datenloggers sonnige oder bewölkte Tage erkennen?
Der digitaler Logger des SWH ONILNE-Projekts, zusätzlich zur Messung der Kesseltemperatur ( Warmwasserverbrauch ) und die Umgebungstemperatur erfasst auch die Lichtintensität. Zu diesem Zweck wird ein LDR-Sensor verwendet. In den Diagrammen können wir die Schwankungen der Lichtintensität sehen, sodass wir die aktuelle Lichtintensität beim Betrachten der Website in Echtzeit kennen und auch die historischen Daten für jeden aufgezeichneten Tag überprüfen können, um dessen Profil (starker Sonnenschein, teilweise Bewölkung, starke Bewölkung usw.) zu verstehen. Das folgende Diagramm zeigt deutlich, wie wir die Lichtintensität ablesen können. Natürlich beobachten wir, dass an Tagen mit starker und stabiler Helligkeit über den ganzen Tag hinweg die Solarleistung deutlich höher ist. An Tagen mit starken Helligkeitsschwankungen, was praktisch Perioden mit starker Bewölkung bedeutet, ist die Leistung des Solarwarmwasserbereiters reduziert. Für das Solar LIVE-Datenerfassungsprojekt wurde ein Live-Webkamera Zudem wurde ein System installiert, das die örtlichen Wetterbedingungen durch Livebilder überprüfen kann.
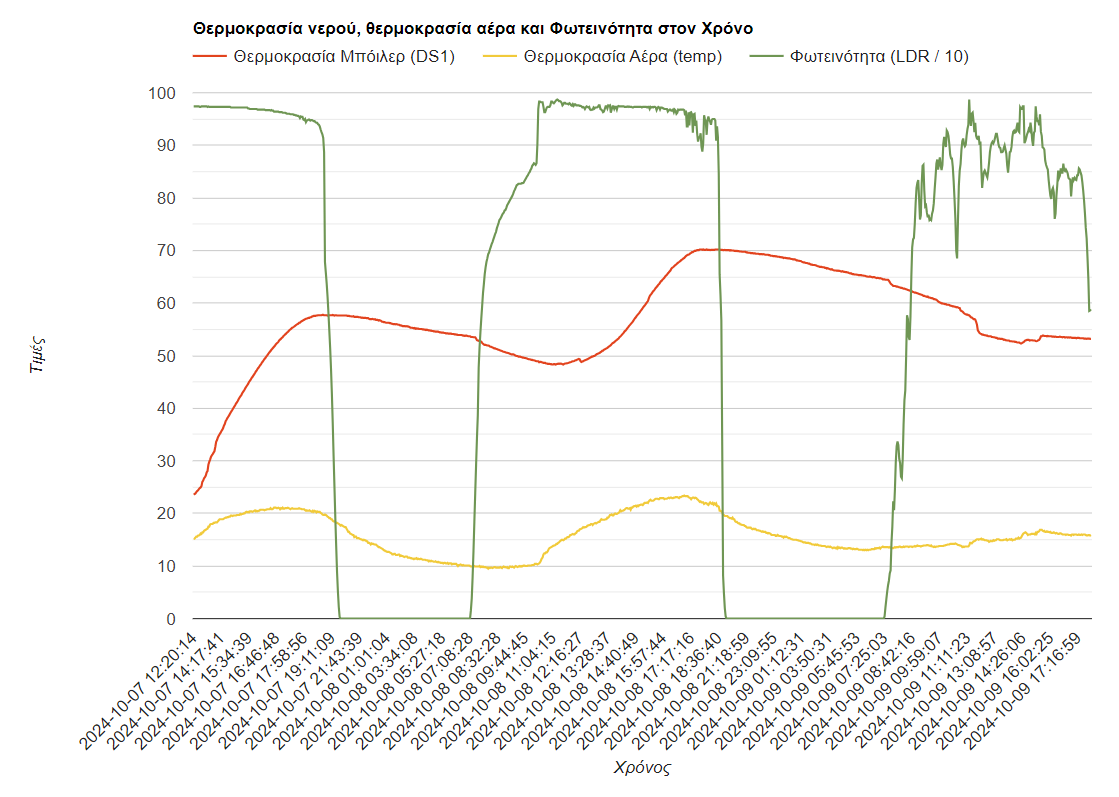
Im 48-Stunden-Chart es wird deutlich gezeigt, wie ein bewölkter Tag aussieht:
MSc in Umweltbildung
Spezialisierung auf Bildungsrobotik und MINT
Spezialisierung auf E-Learning und Produktion von Bildungsinhalten
Staatlich geprüfter Erwachsenenbildner